Using create_missingness_prop_matrix: A Complete Guide
The create_missingness_prop_matrix() function creates a matrix showing the proportion of missing values for each sample–feature combination across multiple timepoints. This matrix can then be used for sample clustering with cluster_on_missing_prop() or as input to the complete CISS-VAE pipeline via run_cissvae().
Overview
The function returns a n_samples × n_features matrix where each cell contains a value between 0 and 1 representing:
proportion = (number of missing timepoints) / (total timepoints)
0.0 = no missing values for that sample-feature combination
1.0 = all timepoints missing for that sample-feature combination
Data Format Support
The function supports two input formats:
1. Wide Format (default)
Columns represent feature×timepoint combinations, rows represent samples.
2. Long Format
Each row represents one sample/feature/timepoint observation.
Wide Format Examples
Example 1: Basic Wide Format with Regex Parsing
import pandas as pd
import numpy as np
from ciss_vae.utils.matrix import create_missingness_prop_matrix

# Create sample wide-format data
# Columns follow pattern: feature_timepoint
data_wide = pd.DataFrame({
    'sample_id': ['mouse1', 'mouse2', 'mouse3'],
    'glucose_t0': [100, 95, np.nan],
    'glucose_t1': [110, np.nan, 105],
    'glucose_t2': [np.nan, 100, 115],
    'insulin_t0': [5.2, 4.8, 5.0],
    'insulin_t1': [np.nan, np.nan, 5.5],
    'insulin_t2': [6.0, 5.1, np.nan]
})

print(f"Data: \n{data_wide}\n\n")

# Basic usage - regex automatically extracts features
prop_matrix = create_missingness_prop_matrix(
    data_wide,
    index_col="sample_id",
    repeat_feature_names = ["glucose", "insulin"],
    timepoint_prefix = "t"
)

print(f"Output: \n{prop_matrix}")
Data:
  sample_id  glucose_t0  glucose_t1  glucose_t2  insulin_t0  insulin_t1  \
0    mouse1       100.0       110.0         NaN         5.2         NaN
1    mouse2        95.0         NaN       100.0         4.8         NaN
2    mouse3         NaN       105.0       115.0         5.0         5.5

   insulin_t2
0         6.0
1         5.1
2         NaN


Output:
         glucose   insulin
mouse1  0.333333  0.333333
mouse2  0.333333  0.333333
mouse3  0.333333  0.333333
Example 2: Custom Regex Pattern
# Data with different naming convention: feature.timepoint
data_custom = pd.DataFrame({
    'ID': ['A', 'B', 'C'],
    'weight_day1': [25.0, np.nan, 27.0],
    'weight_day7': [24.5, 26.0, np.nan],
    'height_day1': [10.0, 9.5, np.nan],
    'height_day7': [10.2, np.nan, 9.8]
})

prop_matrix = create_missingness_prop_matrix(
    data_custom,
    index_col="ID",
    repeat_feature_names = ["weight", "height"],
    timepoint_prefix = "day"
)

print(f"Output: \n{prop_matrix}")
Output:
   weight  height
A     0.0     0.0
B     0.5     0.5
C     0.5     0.5
Example 3: Explicit Column Mapping
data_mixed = pd.DataFrame({
    'subject': ['S1', 'S2'],
    'baseline_glucose': [90, np.nan],
    'followup_glucose': [95, 88],
    'glucose_final': [np.nan, 92],
    'insulin_start': [4.0, 3.8],
    'insulin_end': [4.5, np.nan]
})

# Explicitly map columns to features
column_mapping = {
    "glucose": ["baseline_glucose", "followup_glucose", "glucose_final" ],
    "insulin": ["insulin_start", "insulin_end"]
}

print(data_mixed)

prop_matrix = create_missingness_prop_matrix(
    data = data_mixed,
    index_col="subject",
    column_mapping=column_mapping
)

print(f"Output: \n{prop_matrix}")
  subject  baseline_glucose  followup_glucose  glucose_final  insulin_start  \
0      S1              90.0                95            NaN            4.0
1      S2               NaN                88           92.0            3.8

   insulin_end
0          4.5
1          NaN
Output:
     glucose  insulin
S1  0.333333      0.0
S2  0.333333      0.5
Integration with sample clustering
from ciss_vae.utils.clustering import cluster_on_missing_prop

data_wide = pd.DataFrame({
    'sample_id':  ['mouse1', 'mouse2', 'mouse3', 'mouse4', 'mouse5'],
    'glucose_t0': [100,      95,       np.nan,   102,      98     ],
    'glucose_t1': [110,      np.nan,   105,      108,      np.nan ],
    'glucose_t2': [115,      100,      107,   118,   112    ],
    'insulin_t0': [5.2,      4.8,      np.nan,      np.nan,   5.1    ],
    'insulin_t1': [np.nan,   np.nan,   5.5,      5.3,      5.4    ],
    'insulin_t2': [6.0,      5.1,      np.nan,   np.nan,      np.nan ],
})

print(data_wide)

# Create missingness proportion matrix
prop_matrix = create_missingness_prop_matrix(
    data_wide,
    index_col="sample_id"
)

print(prop_matrix)

# Cluster samples based on similar missingness patterns across features
clusters, silhouette = cluster_on_missing_prop(
    prop_matrix,
    n_clusters=2,
    metric="cosine",
    scale_features=True
)

print("Clusters:", clusters)
print("Silhouette score:", silhouette)
  sample_id  glucose_t0  glucose_t1  glucose_t2  insulin_t0  insulin_t1  \
0    mouse1       100.0       110.0         115         5.2         NaN
1    mouse2        95.0         NaN         100         4.8         NaN
2    mouse3         NaN       105.0         107         NaN         5.5
3    mouse4       102.0       108.0         118         NaN         5.3
4    mouse5        98.0         NaN         112         5.1         5.4

   insulin_t2
0         6.0
1         5.1
2         NaN
3         NaN
4         NaN
        glucose_t0  glucose_t1  glucose_t2  insulin_t0  insulin_t1  insulin_t2
mouse1         0.0         0.0         0.0         0.0         1.0         0.0
mouse2         0.0         1.0         0.0         0.0         1.0         0.0
mouse3         1.0         0.0         0.0         1.0         0.0         1.0
mouse4         0.0         0.0         0.0         1.0         0.0         1.0
mouse5         0.0         1.0         0.0         0.0         0.0         1.0
Clusters: [1 1 0 0 1]
Silhouette score: 0.4639966826516685
Integration w/ CISS-VAE pipeline
The proportion matrix can be used directly in the complete CISS-VAE pipeline via the missingness_proportion_matrix parameter:
from ciss_vae.training.run_cissvae import run_cissvae
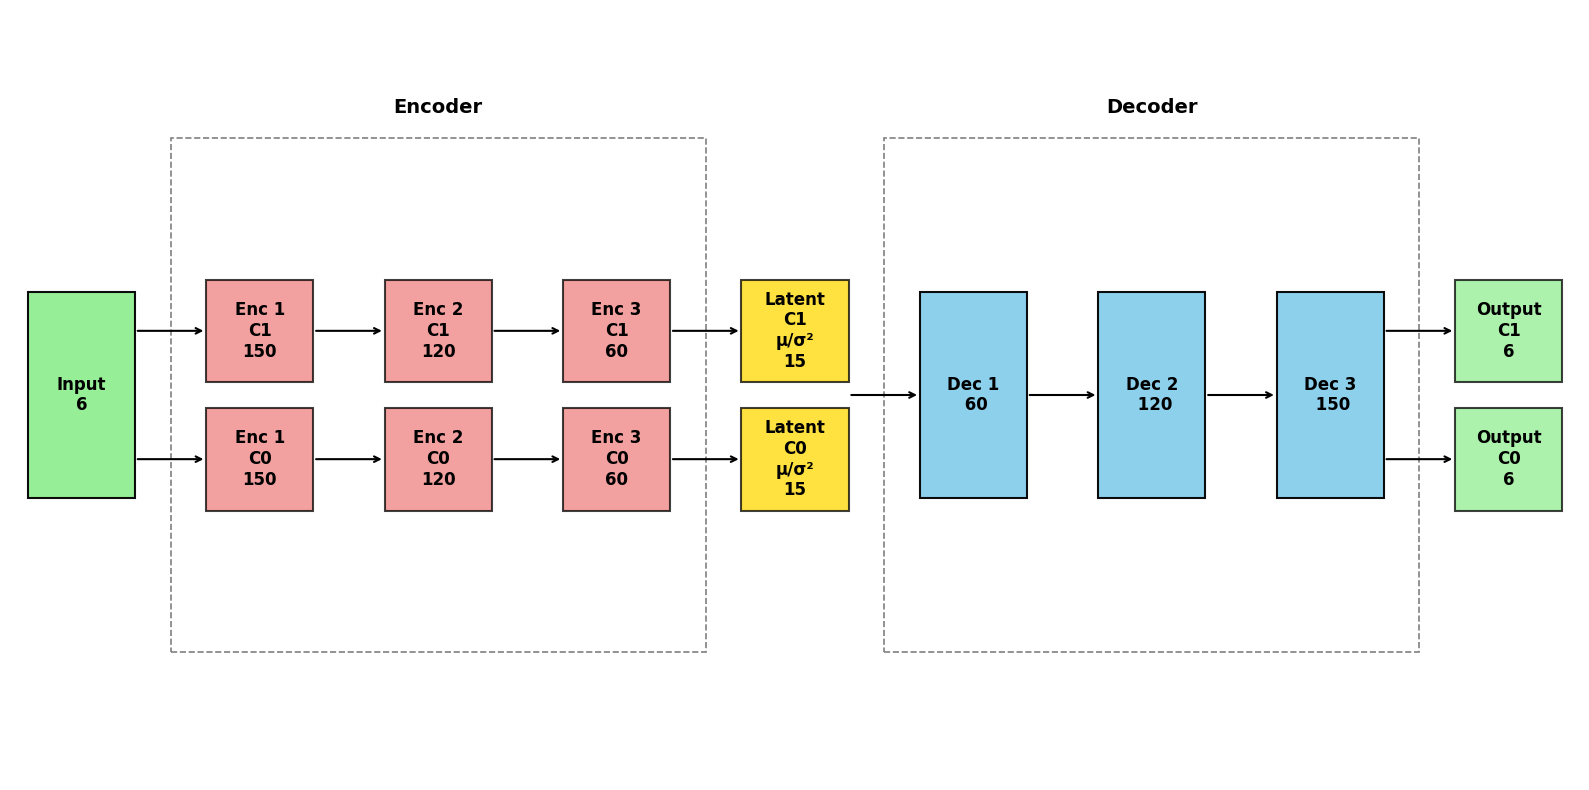
from ciss_vae.utils.helpers import plot_vae_architecture
prop_matrix = create_missingness_prop_matrix(
data_wide,
index_col="sample_id"
)
imputed_data, model = run_cissvae(
data=data_wide.drop('sample_id', axis=1),
missingness_proportion_matrix=prop_matrix, # Use custom matrix
n_clusters=2,
scale_features=True, # Scale the proportion matrix features
verbose=False,
epochs = 50
)
plot_vae_architecture(model)
[Warning] 3 feature(s) had zero std after masking. Replaced with 1.0 to avoid div-by-zero. Features: ['glucose_t1', 'insulin_t1', 'insulin_t2']
Cluster dataset:
 ClusterDataset(n_samples=5, n_features=6, n_clusters=2)
  • Original missing: 10 / 30 (33.33%)
  • Validation held-out: 10 (50.00% of non-missing)
  • .data shape:     (5, 6)
  • .masks shape:    (5, 6)
  • .val_data shape: (5, 6)
  • Validation units: {'glucose_t0': {'kind': 'continuous', 'cols': ['glucose_t0']}, 'glucose_t1': {'kind': 'continuous', 'cols': ['glucose_t1']}, 'glucose_t2': {'kind': 'continuous', 'cols': ['glucose_t2']}, 'insulin_t0': {'kind': 'continuous', 'cols': ['insulin_t0']}, 'insulin_t1': {'kind': 'continuous', 'cols': ['insulin_t1']}, 'insulin_t2': {'kind': 'continuous', 'cols': ['insulin_t2']}}
Full workflow
import pandas as pd
import numpy as np
from ciss_vae.utils.matrix import create_missingness_prop_matrix
from ciss_vae.utils.clustering import cluster_on_missing_prop
from ciss_vae.training.run_cissvae import run_cissvae

# 1. Create longitudinal data with complex missingness patterns
np.random.seed(42)
data = pd.DataFrame({
    'patient_id': [f'P{i:03d}' for i in range(1, 101)],
    # Glucose measurements - some patients miss early timepoints
    'glucose_baseline': np.random.normal(95, 10, 100),
    'glucose_month1': np.where(np.random.random(100) < 0.3, np.nan, np.random.normal(92, 12, 100)),
    'glucose_month3': np.where(np.random.random(100) < 0.2, np.nan, np.random.normal(90, 11, 100)),
    'glucose_month6': np.where(np.random.random(100) < 0.1, np.nan, np.random.normal(88, 10, 100)),
    # HbA1c - different missingness pattern
    'hba1c_baseline': np.where(np.random.random(100) < 0.1, np.nan, np.random.normal(6.5, 0.8, 100)),
    'hba1c_month1': np.where(np.random.random(100) < 0.4, np.nan, np.random.normal(6.3, 0.9, 100)),
    'hba1c_month3': np.where(np.random.random(100) < 0.3, np.nan, np.random.normal(6.1, 0.8, 100)),
    'hba1c_month6': np.where(np.random.random(100) < 0.2, np.nan, np.random.normal(5.9, 0.7, 100)),
})

# 2. Create missingness proportion matrix
prop_matrix = create_missingness_prop_matrix(
    data,
    index_col = "patient_id",
    repeat_feature_names = ["glucose", "hba1c"],
    nonint_timepoint=True
)

print(f"Missingness Proportion Matrix: \n{prop_matrix.head()}")

# 3. Run complete CISS-VAE pipeline
main_data = data.drop('patient_id', axis=1)

imputed_data, model, history = run_cissvae(
    data=main_data,
    missingness_proportion_matrix=prop_matrix,
    n_clusters=2,
    scale_features=True,
    epochs=100,
    verbose=False,
    return_history=True
)

print(f"\nOriginal Data: \n{main_data.head()} \n\nImputed Data:\n{imputed_data.head()}")
Missingness Proportion Matrix:
      glucose  hba1c
P001     0.25   0.25
P002     0.50   0.25
P003     0.50   0.25
P004     0.00   0.50
P005     0.00   0.25
Cluster dataset:
 ClusterDataset(n_samples=100, n_features=8, n_clusters=2)
  • Original missing: 169 / 800 (21.12%)
  • Validation held-out: 56 (8.87% of non-missing)
  • .data shape:     (100, 8)
  • .masks shape:    (100, 8)
  • .val_data shape: (100, 8)
  • Validation units: {'glucose_baseline': {'kind': 'continuous', 'cols': ['glucose_baseline']}, 'glucose_month1': {'kind': 'continuous', 'cols': ['glucose_month1']}, 'glucose_month3': {'kind': 'continuous', 'cols': ['glucose_month3']}, 'glucose_month6': {'kind': 'continuous', 'cols': ['glucose_month6']}, 'hba1c_baseline': {'kind': 'continuous', 'cols': ['hba1c_baseline']}, 'hba1c_month1': {'kind': 'continuous', 'cols': ['hba1c_month1']}, 'hba1c_month3': {'kind': 'continuous', 'cols': ['hba1c_month3']}, 'hba1c_month6': {'kind': 'continuous', 'cols': ['hba1c_month6']}}

Original Data:
   glucose_baseline  glucose_month1  glucose_month3  glucose_month6  \
0         99.967142       92.156023             NaN       87.339202
1         93.617357             NaN       78.972177             NaN
2        101.476885             NaN             NaN       81.481639
3        110.230299      124.642030       86.824755       88.473987
4         92.658466       99.508008       93.549904       79.395866

   hba1c_baseline  hba1c_month1  hba1c_month3  hba1c_month6
0             NaN      5.859505      6.079557      5.634611
1        6.819309      7.239745           NaN      5.757494
2        6.469892           NaN      6.534880      5.492823
3             NaN      7.962037           NaN      5.189670
4        6.591382      6.825535           NaN      5.445506

Imputed Data:
   glucose_baseline  glucose_month1  glucose_month3  glucose_month6  \
0         99.967140       92.156021       97.108841       87.339203
1         93.617355      107.307274       78.972176       92.720222
2        101.476883       82.597275       98.518005       81.481636
3        110.230301      124.642029       86.824753       88.473984
4         92.658463       99.508011       93.549904       79.395866

   hba1c_baseline  hba1c_month1  hba1c_month3  hba1c_month6
0        6.375147      5.859505      6.079557      5.634611
1        6.819309      7.239745      6.351654      5.757494
2        6.469892      6.724995      6.534880      5.492823
3        8.114622      7.962037      7.808603      5.189670
4        6.591382      6.825535      4.805406      5.445506
Extra tips
Sample Clustering:
cluster_on_missing_propclusters samples (rows) based on their missingness profiles across features. This groups subjects with similar patterns of missing data.Data format: Provide the input as a matrix or DataFrame with rows = samples and columns = features. The data must be in wide format.
Scaling: Use
scale_features=Trueif features differ greatly in their overall missingness rates. This standardizes the columns so no single feature dominates the clustering.